
Written by: Anurag Tiwari
From the first “very poor” day on 2 November to a post-Diwali spike, here is how Delhi’s air quality unfolded this week
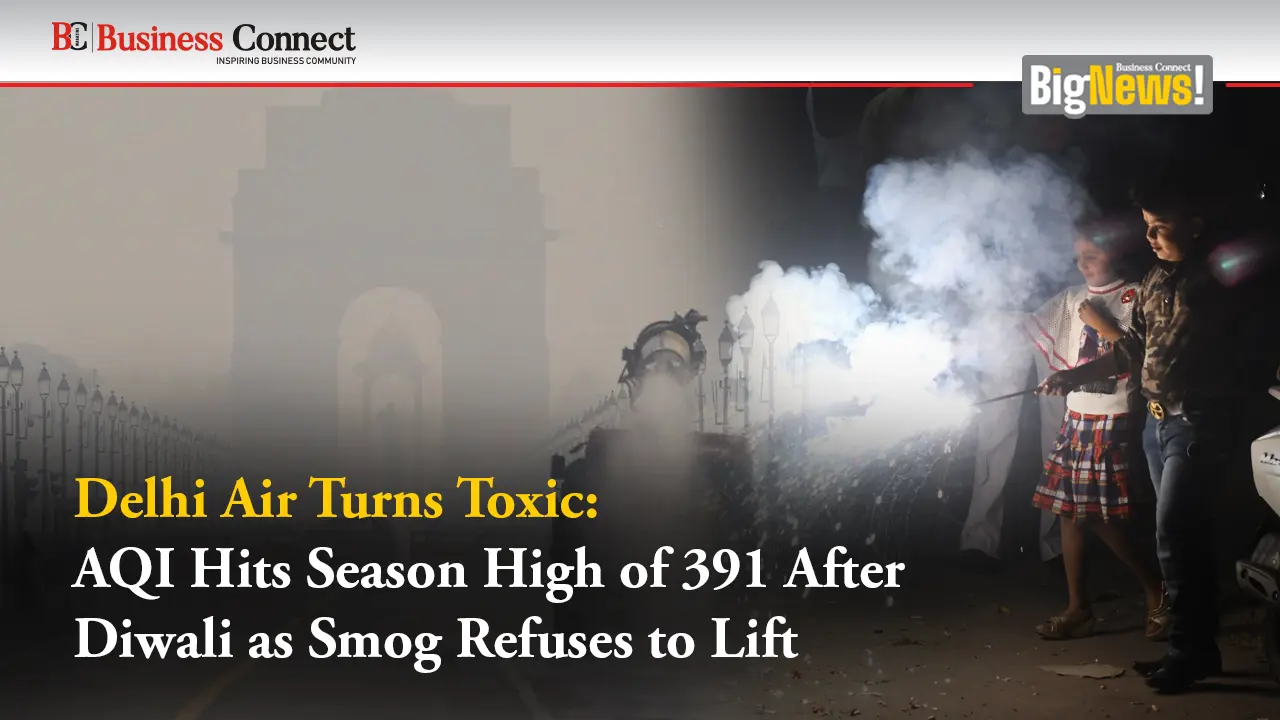
Delhi’s air has gone from bad to worse in a matter of days. The capital’s overall Air Quality Index (AQI) climbed steadily through early November and peaked after Diwali, with several parts of the city crossing the 400 mark.
How the week unfolded
- 2 November: Delhi’s air slipped into the “very poor” category for the first time this season, with an AQI of 312 at 9 am.
- 3 November: The AQI settled at 350, the city’s worst reading in 287 days, with 10 of 57 monitoring stations reporting severe pollution. The last higher reading was 378 on January 20.
- 5 November: The AQI neared 400, with Outlook reporting a reading of 399. Eighteen stations recorded readings above 400. The average for the day was 370, according to ETV Bharat.
- 8 November (Diwali): Delhi’s average AQI stood at 376, with firecracker emissions, vehicle pollution and stubble burning expected to push air quality into the severe category.
- 9 November: The season’s high of 391 was recorded, with several parts of the city crossing 400.
- 10 November: Air quality improved slightly, with the AQI at 345 at 8 am.
Crackers despite curbs
Restrictions on firecrackers did not stop the celebrations. Several parts of Delhi continued to see cracker-bursting till late on Sunday, 8 November, despite the rules. That added to an already heavy pollution load. siasat
Why Delhi’s air gets worse in November
The usual causes combine at this time of year:
- Stubble burning: The stubble-burning period runs from September 15 to November 30.
- Vehicles and local sources: Stubble burning and transport emissions are expected to contribute to Delhi’s PM2.5 pollution.
- Weather: Cooler temperatures and weak winds trap pollutants near the ground. Easterly winds were expected to weaken further on November 9.
What officials have said
The Air Quality Early Warning System said air quality was likely to stay in the “severe” category from November 9 for a few days. On policy action, GRAP-3 measures were still on hold, so the next stage of curbs depends on how readings move in the coming days.
Why different numbers appear
You may see very different AQI figures in the news. Official CPCB averages cover monitoring stations across Delhi, while private trackers use different sensors and methods. For example, the private tracker AQI.in put the city’s average around 545 on 4 November. That is well above the official figures for the same period, so it’s best to check which source a number comes from.
How to protect yourself
- Limit outdoor exercise and avoid peak traffic hours.
- Use a well-fitted N95 or FFP2 mask outdoors.
- Keep windows closed during peak pollution and consider an air purifier indoors.
- Children, older adults and people with asthma or heart conditions should take extra care and consult a doctor if symptoms worsen.
What to watch next
- Whether the post-Diwali dip to 345 holds, or readings climb back above 400.
- Whether authorities move ahead with GRAP-3 restrictions.
- How stubble burning and wind conditions behave through the end of November.
Note: AQI readings change hourly, and different outlets quote different times and stations. Check the CPCB’s live data before publishing.
Add Business Connect magazine to your Google News feed